


4.4. Overviews and Grouping
Find the main pattern, write it as an overview with no figures, and turn its split into the two grouped paragraphs beneath it.
You should spend about 20 minutes on this task.
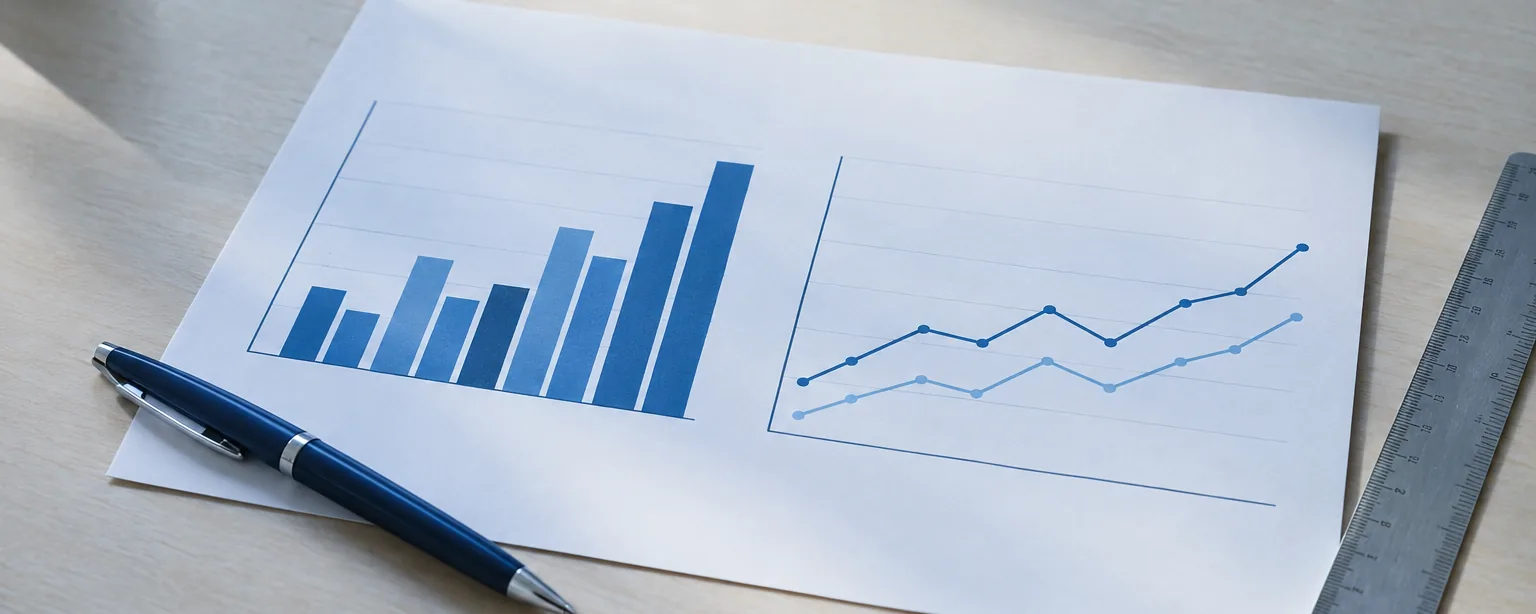
The chart below shows the average number of hours per week that two age groups in one country spent on five leisure activities in 2022.
Summarise the information by selecting and reporting the main features, and make comparisons where relevant.
Write at least 150 words.
The short version
An overview is one or two sentences after the introduction that name the main pattern. Without one, task achievement stops at Band 5.
It states the big picture: what stays true when the small numbers vanish.
Its split becomes your two groups, and each group gets a body paragraph.
Figures belong in the body. The overview has none, or one at most.
What you have to do
The test shows a chart, graph or table with an instruction line above. You write a report of at least 150 words in about 20 minutes. Its second paragraph is the overview: one or two sentences that name the main pattern with no figures. Two detail paragraphs follow, each on one group of figures that behave alike. The overview decides most of the task achievement mark, and the grouping decides most of the coherence mark.
What a pattern looks like
A pattern is something true of the whole chart, not of one bar. On the chart above, the older group spent 18 hours on television is one bar. The older group spent longer on three of the five activities is a pattern. Other patterns: one line rises while another falls, two lines cross, one category dwarfs the rest, or everything moves the same way.
Step by step
- 1Read the instruction line, then look for the biggest shape
The line tells you what is measured, for whom and when. Read it before you look at the bars. Then ask one question of the chart: what would still be true if the small differences disappeared? On the chart above, the older group leads on three activities and the younger on two. Social media is the widest gap. Write that shape down in five words before anything else.
- 2Decide what the overview must contain: the pattern, then its split
The overview is one or two sentences straight after the introduction, naming the pattern with no figures. It should also give you the split for the body: the categories one series leads on, and those the other leads on. On the chart above, the first group is television, reading and gardening, and the second is social media and exercise. Each group gets one paragraph, with two or three figures inside it.
- 3Paraphrase the instruction line, then open the overview with *Overall*
Your first sentence says what the chart shows in your own words. For example, shows the average number of hours per week becomes compares the weekly hours. Your second sentence begins Overall, so the examiner cannot miss the overview. Then name the pattern: Overall, the older group spent far longer on television, reading and gardening, while younger adults spent more time on social media and exercise.
- 4Leave the figures, the exceptions and the reasons out
An overview has no figures, or one at most. 18 hours against 9.5 is evidence, and it goes in the body under the claim it supports. Leave out the small exception too. If four bars rise and one dips slightly, the overview says rose in almost every case. Never give a reason, because the chart shows what, never why.
- 5If no pattern jumps out, use the fallback plan
For a chart with two series, split the categories by which series is higher. Then write Overall, A was higher for X and Y, while B led on Z. For a graph over time, compare each line's first and last figure and say which rose, which fell, and which finished highest. Either sentence is a real overview, and either split gives you two groups to write about.
Overall, the older group spent far longer on television, reading and gardening, while younger adults spent more time on social media and exercise. Social media showed the biggest difference of all.
- CoherenceOne word tells the examiner the overview has started.
- TaskA comparison with no figure. The 18 hours against 9.5 waits for the body.
- CoherenceThe sentence splits into two groups, and each becomes a body paragraph.
- TaskOne feature singled out. Its figure is left for the body.
Coloured text shows what the examiner is looking for.
Quiz time5 questions
Each drill gives you the figures it needs. Practise one judgement at a time: is this a pattern, and which figures belong together?
Overview or detail?
Read the figures, then decide where the sentence belongs.
Read thisRainfall in two cities, mm per month, 2021. Porto: 150 in January, 90 in April, 20 in July, 120 in October. Lima: 2 in January, 1 in April, 8 in July, 3 in October.
Overall, Porto received far more rain than Lima in every month, with a clear winter peak.
Which sentence is the overview?
Read the figures for both age groups, then choose the sentence that names the main pattern.
Read thisSmartphone ownership, % of adults, in 2010, 2015 and 2020. Under 30s: 45, 80, 95. Over 60s: 5, 30, 75.
Which sentence is the overview?
Make the two groups
Five products, two years. Choose the grouping that gives the two body paragraphs.
Read thisExports of five products, million dollars, 2012 and 2022. Coffee: 300 to 520. Tea: 120 to 130. Cocoa: 200 to 350. Sugar: 400 to 380. Bananas: 90 to 85.
Which grouping gives the two body paragraphs?
Spot the sentence that belongs in the body
Four sentences form an overview. One of them is evidence, not pattern, and belongs in a body paragraph. Choose it.
Read thisCar-free days per year in three cities, 2015 and 2023. Bergen: 2 to 12. Lyon: 4 to 6. Leeds: 1 to 1.
Which sentence contains the error?
Write one overview sentence
Write one or two sentences that name the main pattern. Begin with Overall and use at most one figure.
Read thisEnergy drink sales, million litres, in 2016, 2019 and 2022. Supermarkets: 40, 55, 70. Small shops: 60, 58, 50. Online: 5, 15, 35.
Write the overview for these figures.
0 / 12 words
Set up your learning path at the top of this lesson to get band-specific feedback.
The full model
Below is a line graph with its introduction, its overview and the two grouped paragraphs the overview sets up. Read the overview first, then check that each paragraph stays inside its group.
Weekday and weekend passengers at four dates. Check each statement in the exercises below against it.
The line graph compares weekday and weekend ferry passengers, in thousands, between 2016 and 2022. Overall, weekday travel was higher than weekend travel throughout, both lines fell sharply in 2020, and weekend numbers had almost caught weekday traffic by 2022. Both services carried far fewer passengers in 2020. Weekday travel, which had risen from 40,000 to 44,000 between 2016 and 2018, dropped to 18,000, while weekend traffic fell from 28,000 to 12,000. By 2022 both had recovered, weekday numbers to 36,000 and weekend numbers to 34,000, so the gap between them had almost closed.
The overview names three patterns and no figure. Paragraph one groups the fall, paragraph two the recovery, and every figure sits under the pattern it supports.
Three towns, two years, six figures, in thousands: 22 on the chart is 22,000 trips. Group them before you write: which town changed most, which moved the same way, and which went the other way.
Your turn to write5 questions
Overview or detail?
Where does this sentence about the ferry graph belong?
Weekday traffic was higher than weekend traffic in every year shown.
Overview or detail?
Where does this sentence about the ferry graph belong?
Weekday travel reached 44,000 in 2018.
Overview or detail?
Where does this sentence about the ferry graph belong?
Both lines fell sharply in 2020.
Overview or detail?
Where does this sentence about the ferry graph belong?
Weekend numbers rose from 12,000 to 34,000 between 2020 and 2022.
Write the two groups
In two short sentences, group the cycle-trip figures. Do not give each figure its own sentence.
Daily cycle trips to work (thousands), 2014 → 2024: Harbour 8 → 22, Ridge 14 → 16, Fen 11 → 9.
0 / 20 words
Set up your learning path at the top of this lesson to get band-specific feedback.
Tips
- Write the overview second
Introduction, then overview, then detail. The examiner meets it in the first minute, and it cannot be lost to the clock.
- Test a sentence before it goes in the overview
Cover the numbers with your hand. If the sentence is still true of the whole chart, it is overview. If it needs a number, it is detail.
- Give each group a topic sentence
Start each body paragraph with the group's claim, not with a figure: The older group spent far longer on three activities. Then give the figures.
Recap
Find the main pattern first: what stays true when the small numbers vanish.
Write it as one or two sentences straight after the introduction, opening with Overall and using no figures.
Turn the overview's split into two groups, and give each group one paragraph with a few figures.
Next: the language you need to describe numbers precisely.